From Invisible to Recommended by AI: How I Got ChatGPT to Recommend Me in 7 Weeks
- Do make the page the best-matching answer to the exact question. Semantic match between query and passage was worth 3.27x the citation odds per standard deviation, more than every authority, formatting and freshness variable in the model combined.
- Do aim at how people actually ask, not at the tidy questions a language model invents. Real queries run a median of 11 words, nearly half start lowercase, and 12% are bare keyword fragments a model never produces. Digital Twins calibrated against real behaviour supply both the what and the how.
- Do put the answer in the first 60 words. An opening that answers the query in the asker's own terms doubles the citation odds per standard deviation (2.02x), the strongest formatting lever in the model. Keep FAQPage schema as cheap hygiene: the markup itself showed no reliable effect once answer-first content was measured directly. Don't run a backlink campaign for AI visibility: both link variables were statistically null.
- Do run this as a weekly loop rather than a one off project. The same agentic framework of skills runs every week, keeps what it learned about your audience, and keeps you findable on ChatGPT for the queries people actually type.
In spring 2026 my personal site was getting roughly 50 visitors a month. Nothing was broken. It was simply invisible, both to Google and to the assistants people now ask instead of Google. A typical AI answer names about 2.8 brands, and I was not one of them for a single query that mattered to my business.
Since then I have run a weekly optimisation loop on my own site, and in parallel a pre-registered quasi-experiment on 52,821 AI citations to check whether my tactics are the ones that actually move citations. This piece is both halves: what I did, and what the data says about why it worked.
The one thing that decides whether you get cited
Semantic match between the question and a passage on your page. In the pre-registered model on 52,821 citations it is the strongest variable by a distance, worth 3.27 times the citation odds per standard deviation (95% interval 2.68 to 4.01), more than every authority, formatting and freshness variable in the model put together. Everything else in this article is a detail next to it.
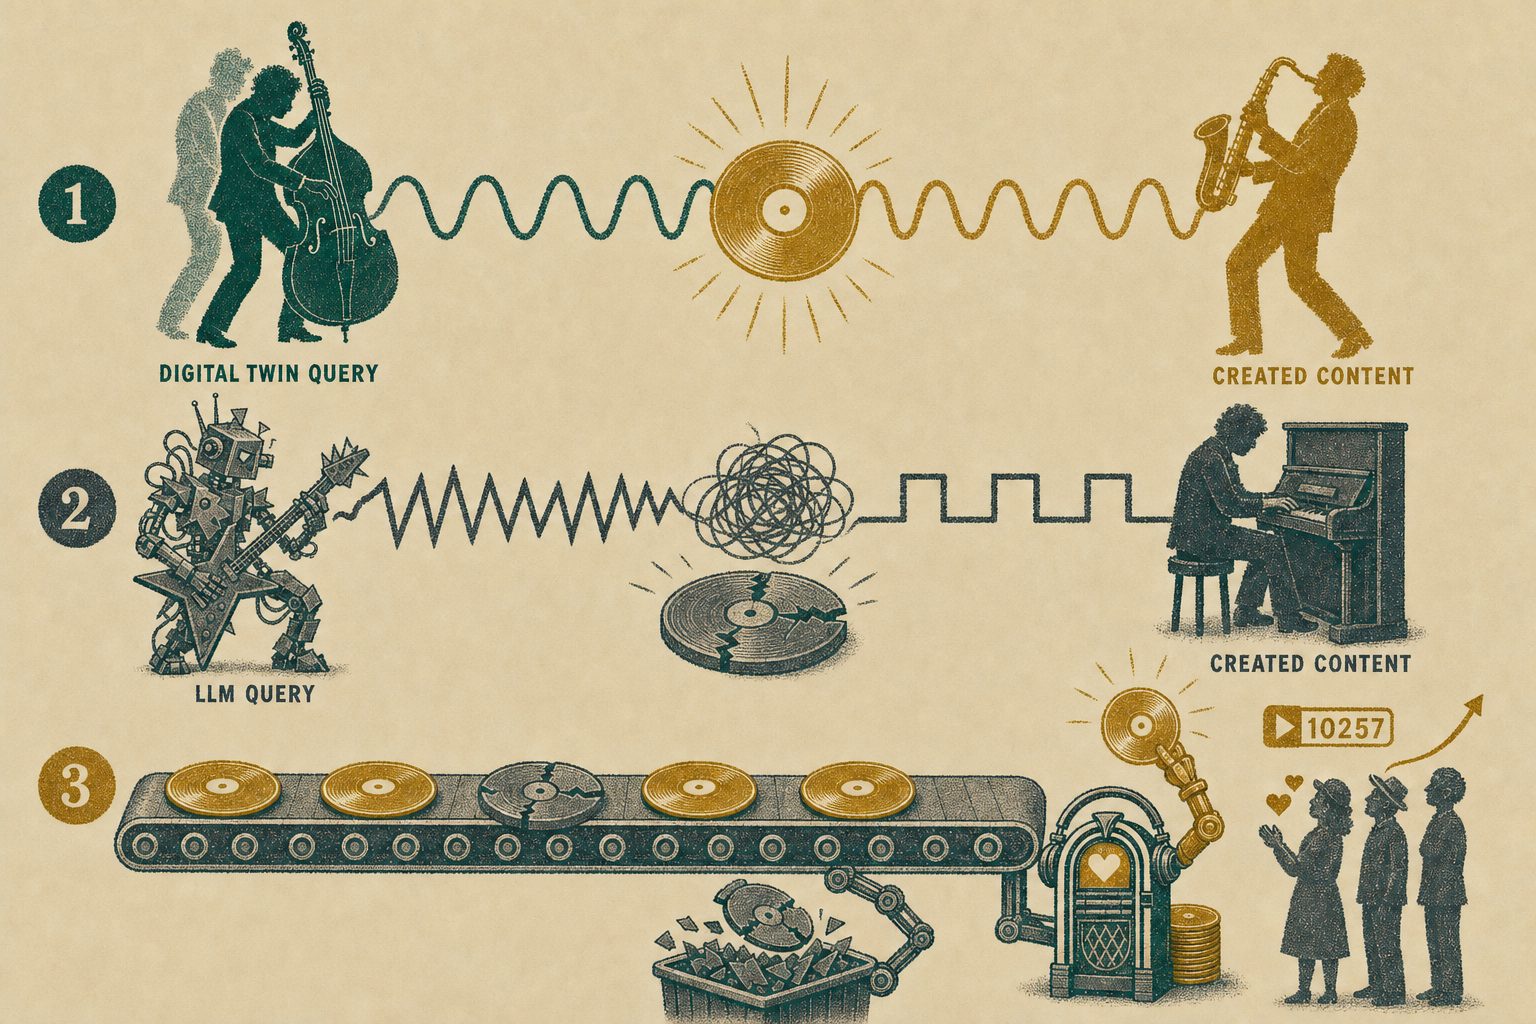
Without the jargon: the assistant cuts your page into passages of roughly fifty words, turns the question and every passage into a numeric representation of meaning, and cites the one whose meaning sits closest to the question. Matching the meaning is the job, and using the asker's own words is how you get the meaning to line up.
Why you cannot match a query you cannot predict
Because the centre of that map is a real question, you have to know how real people phrase it, and almost nobody checks. Aim a passage at the tidy version an assistant would have invented instead and the semantic match you were chasing never happens.
I can check that against something most people cannot. neuroflash, where I am CIO, sees how people really phrase things, both what they ask and how they type it. Set the profile of real queries against what a language model invents when asked for search queries and only the length of the query comes close.
* Queries were sampled from ~20 million real human queries on neuroflash.com.
So the query set has to be simulated against real behaviour rather than imagined. That is what the Digital Twins do in the loop below: step 1 simulates the audience, step 2 has them produce search behaviour calibrated to the real distribution above, which is how you get the centre of the map instead of a guess at it. Get those two wrong and every later step optimises a page for a question nobody sends.
How the twins build the query set, in two steps
Both halves are needed. The twins supply the what, the thing a given persona would go looking for. The calibration pass supplies the how, the shape that intent takes when somebody types it into a chat window.

Alina, 25
advertising and marketing, Berlin
Cares whether a speaker will land with a team in their twenties.
search intent
Find a keynote speaker whose AI material connects with a young audience.

Nadine, 37
HR assistant, Stuttgart
Organising a leadership day, so budget and logistics decide.
search intent
Find out what an AI keynote costs and how travel and timing work for a one day event.

Korbinian, 63
distribution manager, Rosenheim
Wants to know whether the spend pays off at his company's size.
search intent
Work out whether an AI keynote is worth it for a mid sized company.
ai speaker who gets gen z audience
7 words, lowercase
ai keynote cost leadership event
5 words, bare search keyword
is an ai keynote worth it for a mid sized company
11 words, lowercase
Calibration target, the real queries measured above: median 11 words, 46% starting in lowercase, a question mark on fewer than half.
The starting point: 50 visitors a month and zero AI mentions
Before the rebuild, my site was a WordPress install that loaded 468 KB of homepage HTML, 60 scripts and 9 stylesheets, scored 70 on PageSpeed, and appeared in about 16 Google impressions per day. On my frozen query set, ChatGPT named me in 3.7% of answers. For commercial queries such as "best AI keynote speaker" I was absent entirely, while other names were recommended by default.
I applied my own method to myself first, for a simple reason: I sell this work, and I would rather not sell something I have not survived personally.
The weekly loop I run on my own site
The loop has seven steps and takes one working session a week. Simulate the audience, generate the queries they really type, measure across engines, read the gaps, write content the twins approved, deploy, then measure again seven days later.
The seven steps, and the skill behind each one
Almost none of it is done by hand. Every step runs on a named skill inside an agent framework I built and run on my own machine, and the framework remembers between weeks: the audience, the frozen query set, what has already been published and what the twins rejected all carry forward. That memory is why week ten costs less effort than week one instead of more.
- Simulate the audience with Digital Twins. Personas invented by a language model are close to a coin flip. Twins grounded in real survey respondents answer like the people who actually book keynotes, and the audience definition is written down once and reused every week rather than rebuilt from scratch.
- Generate queries that sound human. Twins produce search behaviour along the journey, calibrated against the real query distribution shown above rather than against a keyword tool. The query skill keeps that set frozen, which is what makes one week's numbers comparable with the next.
- Measure with an AI visibility tracking provider (Peec.ai, Rankscale and others). The query set runs through ChatGPT, Gemini, Copilot, Perplexity and Claude, returning share of voice, citation rate and position per persona and journey stage. The audit skill runs that scan the same way every time and scores it against the competitors I care about, so the baseline is taken before any content changes and stays comparable.
- Read the gaps, branded and unbranded kept apart. The interesting cell is not "position 7", it is "does not appear at all". Mixing branded queries into the average flatters the score and hides the gap. The same skill hands back the absent queries as next week's writing brief.
- Write twin tested content. The GEO article writer skill drafts answer-first against the query it is aimed at, and before publishing the twins rate title, hook and opening while a fact checking pass runs against every number and source link.
- Publish content. WordPress out, static HTML in. PageSpeed went from 70 to 97 and homepage HTML from 468 KB to 14 KB. The website editor skill edits, previews, deploys and verifies with a rollback path, so a gap read on Monday morning can be answered by a live page the same day.
- Re-measure and repeat. Weekly on the changed pages, monthly on the whole query set. The gap analysis produced a backlog of 44 review passed articles, published at a maximum of two per week, and the video repurposing and LinkedIn skills take each one into clips and posts, which the engines pick up in days rather than the month a new page needs.
What the loop changed in six months
Four numbers describe the result. PageSpeed 70 to 97. Google impressions from about 16 per day before the relaunch to about 287 per day now, with clicks following the same curve from well under one a day to roughly two. ChatGPT mention rate from 3.7% to 17.4%, which is 40 of 230 measured answers, seven weeks after we started measuring. And the business number: three keynote booking calls came in through the optimised speaker pages, two of them converted, roughly €10,000 in revenue.
One booking made it concrete. A client asked ChatGPT for the best AI keynote speaker in Hamburg, got my name, checked the site, and booked a mid four figure keynote. No ad spend, no outreach, no intermediary.
Why one booking is not evidence, and what I did about it
A single win proves nothing. AI answers reshuffle themselves week to week without any intervention, so any before and after on a handful of queries is mostly noise. To find out what really drives citations, I built a pre-registered model on 1,362 queries, 2 engines and 3 snapshots taken between 2 and 16 July 2026, covering 52,821 citations and 847 fetched pages.
Twenty-six variables were declared before the data was touched, covering relevance, authority, formatting, freshness, page structure and the content claims of the current GEO playbook. Cited pages are compared against pages cited for other queries in the same language, engine and topic, so query difficulty and engine are absorbed by design. The model discriminates at AUC 0.874, and only the week to week persistence model on 7,701 page and query pairs approaches a causal reading.
The findings that changed how I write
Beyond raw semantic match, two things move the odds up and one moves them down. An opening that answers the query and a title carrying the query's words raise the odds, dense list formatting lowers them, and the rest of the conventional playbook, backlinks, FAQ markup, question shaped headings, shows no independent effect once page content enters the model.
| Factor | Effect on citation odds |
|---|---|
| Query to passage semantic match | 3.27x per standard deviation |
| The first 60 words answer the query | 2.02x per standard deviation |
| Title contains the query's own words | 1.96x per standard deviation |
| FAQPage or HowTo schema present | no reliable effect (p = 0.27) |
| Domain or page backlinks | no effect (p = 0.42 and p = 0.15) |
| List and table density | 0.89x per standard deviation |
Five things follow. Put the query's actual words in the title, because title overlap roughly doubles the odds even with semantic similarity controlled. Answer in the first 60 words, because an opening that matches the query is the strongest formatting lever in the model and early citations survive next week's re-retrieval. Keep the schema block as cheap hygiene rather than as a strategy: the markup showed no reliable effect of its own once answer-first content was measured directly, and question shaped headings alone never paid either. Skip the backlink campaign and rewrite for relevance instead. And stop padding: no page length target earns citations, while recently published pages do slightly better.
The section length that gets cited, and why page length is not a lever
About 145 words per section. That is where the model's predicted citation probability peaks, inside the 120 to 180 word window practitioners have claimed for years, and it is the one piece of chunking folklore this data supports. Whole page length runs the other way: there is no 500 to 1,500 word sweet spot anywhere in this corpus, and added length never earns a citation on its own.
I tested the 2026 best-practice playbook, and most of it died
The study also put the advice circulating in the AI search community under the same microscope: semantic triples, entity density, self-contained sections, covering a topic's whole subquery tree on one page. Each claim became a pre-registered variable; the content measures were scored across 818 fetched pages by 13 independent AI raters, and every headline result was attacked by an adversarial verification pass before I believed it. One claim survived.
| Best-practice claim | What the data said |
|---|---|
| Answer the query in the first 60 words | 2.02x citation odds per SD, stable under every check |
| Pack in semantic triples (quotable "X is Y" facts) | no reliable effect, see below |
| Raise named-entity density | inconclusive, measurement too noisy to test |
| Make every section self-contained ("extractability") | inconclusive, two measures of it barely correlate |
| Cover the topic's whole subquery tree on one page | no effect either way once relevance is controlled |
| FAQ schema as a citation driver | no reliable effect: the markup rides on the answer-first content under it |
The one survivor is the strongest formatting result in the whole project. Pages whose first 60 words semantically answer the query earn roughly twice the citation odds per standard deviation, and the estimate barely moved under every robustness check I threw at it. It is relevance delivered early rather than a separate trick, which is exactly why it works: retrieval reads from the top, and an opening that already matches the question wins the passage contest before the rest of the page is even considered.
The failures taught me as much as the survivor. The semantic-triple claim looked spectacular at first, over 40% higher citation odds with a vanishing p value, until the verification pass traced the whole thing to a single miscalibrated rater batch that counted about 2.5 times higher than the other twelve. Remove those 60 pages and the effect is gone, in the citation model and in the week-to-week persistence model. That is why every variable here is declared before the data is touched and every headline gets attacked before it gets published: the difference between a finding and an artifact is usually one robustness check somebody actually ran.
What I would do first if I started from zero today
Start with measurement, not content. Build a query set that sounds like your customers rather than like a keyword tool, measure where you are absent per engine, then fix the three pages closest to a buying decision: title rewritten with the query's words, answer moved to the top, FAQ schema added.
Expect movement in weeks, not quarters. A new page needs roughly a month to enter the engines, while a LinkedIn post can appear the next day, which argues for publishing now rather than planning a launch. Then re-measure on a fixed cadence: without a baseline you cannot separate a real gain from the churn the engines produce on their own.
One note on where this goes next. The weekly loop is not willpower, it is the package of skills behind it: the audit that measures, the article writer that drafts, the website editor that ships, the twin pretesting that decides what is good enough to publish. I teach that package on the AI visibility page, set up on your own machine rather than rented from an agency, and there is a free intro call there if you would rather ask first whether it fits your situation.
Frequently asked questions about AI visibility
What actually makes ChatGPT cite a page?
How closely a passage on the page matches the meaning of the question. In a pre-registered model on 52,821 citations, semantic match between query and passage carried 3.27 times the citation odds per standard deviation (2.68 to 4.01), more than every authority, formatting and freshness variable combined. The practical version: write the answer in the words the asker uses, in the first 60 words of the page.
How long does it take before ChatGPT recommends you?
On my own site the first measurable movement came within weeks of publishing, and the mention rate went from 3.7% to 17.4% over roughly six months of weekly iterations. A newly published page typically needs about a month to be picked up by the engines.
Do backlinks help with AI visibility?
Not independently. Domain referring domains and page level backlinks both went statistically null once page content and query relevance entered the model (p = 0.42 and p = 0.15). The study could not measure unlinked brand mentions or organic rank, so read this as "no independent effect inside the AI visible pool", not "links never matter".
Does FAQ schema really increase AI citations?
Less than it appears. Pages carrying FAQPage, QAPage or HowTo JSON-LD do get cited more often, but in the full model the markup itself showed no reliable independent effect (p = 0.27): the model attributes the citations to the answer-first content those pages tend to carry. Keep the schema, it costs nothing, but put the effort into the first 60 words.
Do semantic triples or entity density improve AI citations?
Neither survived testing. Across 818 scored pages, the apparent semantic-triple effect traced back to a rater artifact and entity density stayed statistically inconclusive. The content variable that held up was whether the page's first 60 words answer the query, at roughly double the citation odds per standard deviation.
How many queries do you need to measure reliably?
Hundreds, not a handful. AI answers reshuffle themselves substantially week to week with no intervention at all, so a three query check before and after a change measures noise. My own pulse runs on a frozen set of over 1,300 queries.
Sources and method notes
- All modelling figures come from my own pre-registered quasi-experiment on the citation panel of an AI visibility tracking provider: 26 variables declared before analysis (20 page and domain variables plus 6 content-claim variables), 1,362 queries, 2 engines, 3 snapshots (2 to 16 July 2026), 52,821 citations, 847 fetched pages, AUC 0.874 with grouped cross validation by query.
- Effects are reported as standardised odds ratios inside query, engine and snapshot risk sets, with multiplicity controlled at q < 0.05. The citation models are correlational. Only the persistence model (same page, same query, one week apart, n = 7,701) approaches a causal claim.
- The six content-claim variables (semantic triples, entity density and diversity, extractability, answer-first lead match, topic-tree coverage) were scored across 818 pages by 13 independent LLM raters. Reported effects are gated by rater-batch sensitivity corrections and an adversarial verification pass; an estimate that failed those checks is reported as unreliable rather than as an effect.
- Declared omitted variables: organic top 10 rank, unlinked brand mentions and the internal link graph. The authority nulls inherit those omissions.
- Site figures (PageSpeed, impressions, clicks, mention rate) come from Google Search Console daily data, PageSpeed Insights and the AI visibility tracking pulse of 17 August 2026 on my own domain, which is a single site rather than a controlled sample.
- Query realism figures come from our own analysis of real user behaviour on neuroflash, sampled from ~20 million real human queries. The comparison figures for language model output are measured on raw generator output before any rewriting pass.
One site, honestly measured, plus one pre-registered model on other people's citations as well as my own. That combination is what turned a set of tactics into a method.