We Tested 12 Startup Myths Against 8,352 Stripe-Verified Startups (and Our Own AI)
Why I spent a month stress-testing startup advice (and my own product)
Every week, LinkedIn serves founders the same confident advice: lead with pain. Talk to the customer, not about the product. Drop the "AI" from your name, the fatigue is real. Most of this advice has never touched a revenue number.
In July 2026 we got our hands on something unusual: 8,352 startups that publicly verify their revenue through their payment provider (Stripe and others) on the TrustMRR platform. Not survey answers. Not self-reported ARR at a conference bar. Verified money, month by month, including the startups that earned exactly zero and died.
As a cognitive neuropsychologist who co-founded a digital-twin research company, I wanted two things from this dataset. First: what does verified revenue actually say about the copywriting and growth rules everyone repeats? Second, and this is the uncomfortable part, could our own AI panels have predicted any of it? We designed two experiments with explicit kill clauses, meaning we committed in advance to publish failure as prominently as success. You'll see below why that clause mattered.
Disclosure: I’m the co-founder of neuroflash, a digital-twin provider. This article reports results that are partly unflattering for our own product category. The full methodology, including both null results, is summarized in the transparency section at the end.
Part 1: What 8,352 verified-revenue startups actually show
Myth 1: "You have years to find traction"
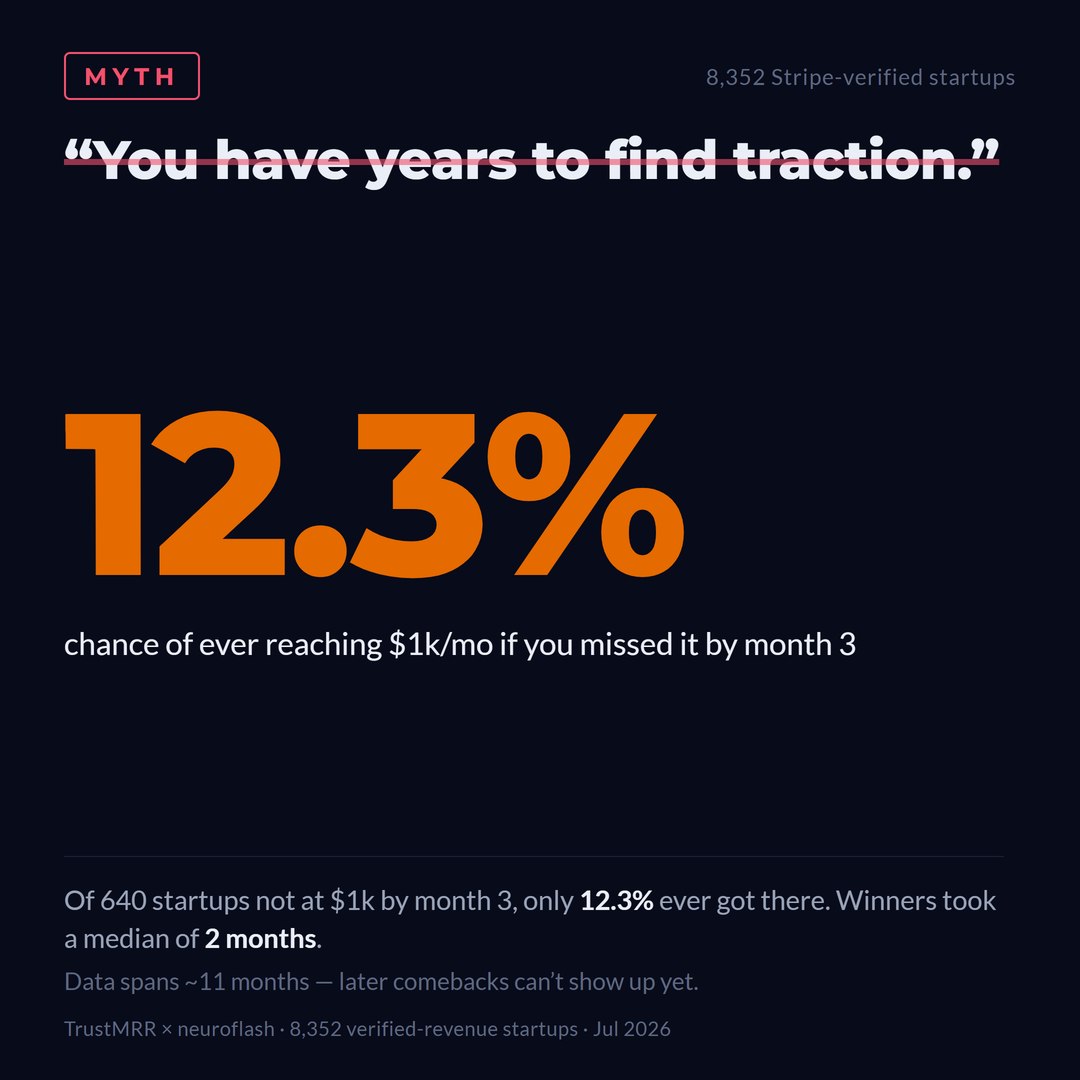
The single most sobering number in the dataset: among startups that had not reached $1,000 in monthly revenue by month 3, only 12.3% ever got there in the observed window. Money arrives fast or it usually doesn't arrive: 75% of startups that ever earn a dollar earn their first one within two months, and the median time to a first $1k month, among those who reach it, is just two months. The romantic story of the slow-burn compounder exists, but in this ecosystem it is the rare exception, not a plan. (Caveat: the observation window is ~11 months, so year-two ignitions are invisible, but that cuts both ways for planning purposes.)
Myth 2: "Startups die slowly, after long declines"
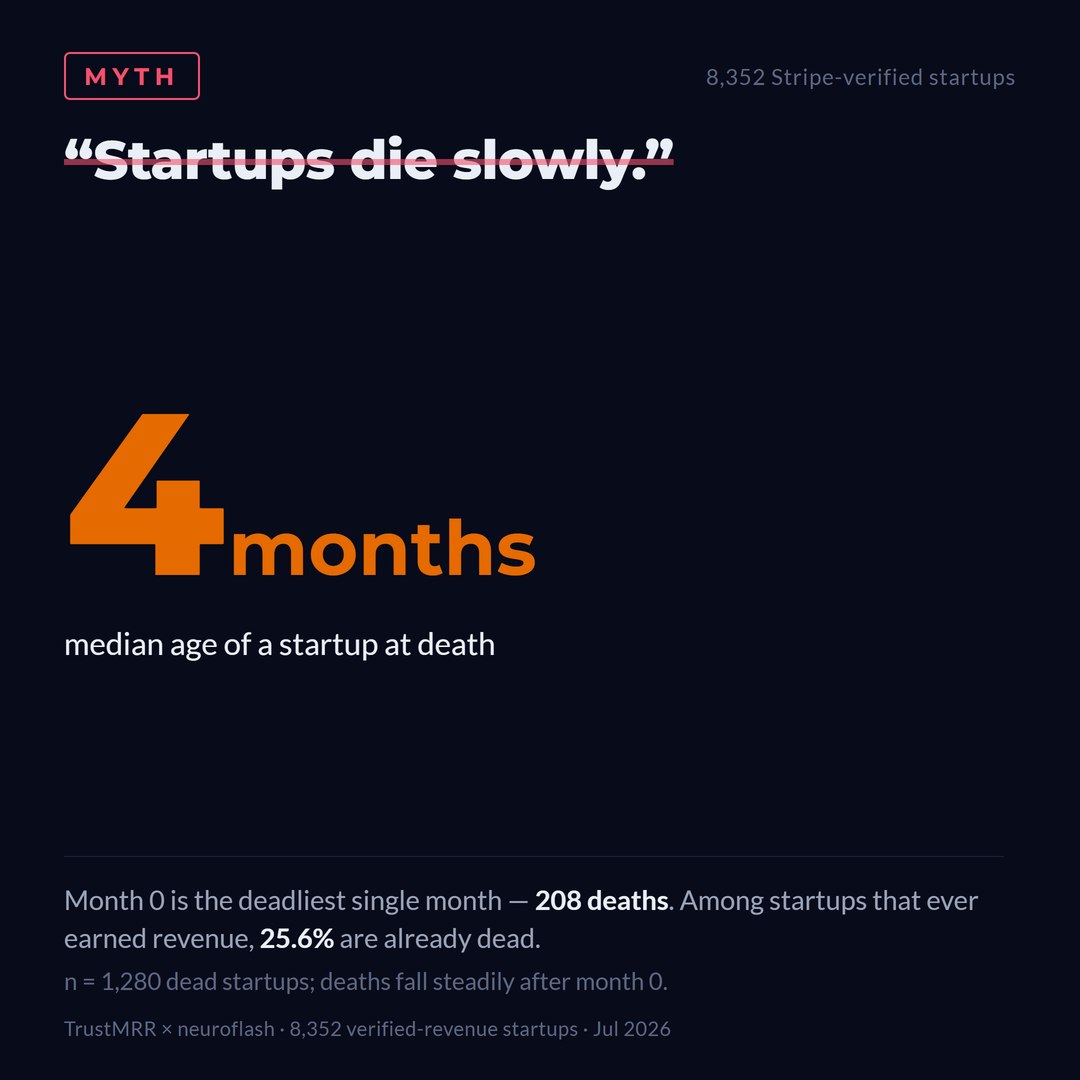
Among 1,280 dead startups with a known founding date, the median age at death was 4 months, and month 0 was the single deadliest month. A quarter of all startups that ever earned revenue were already dead within our 12-month observation window. Death here rarely looks like a long decline; it looks like a launch that never caught. Notably, traction is not immunity: 161 of the dead had peaked above $1k/month before flatlining.
Myth 3: "That MRR screenshot means they made it"
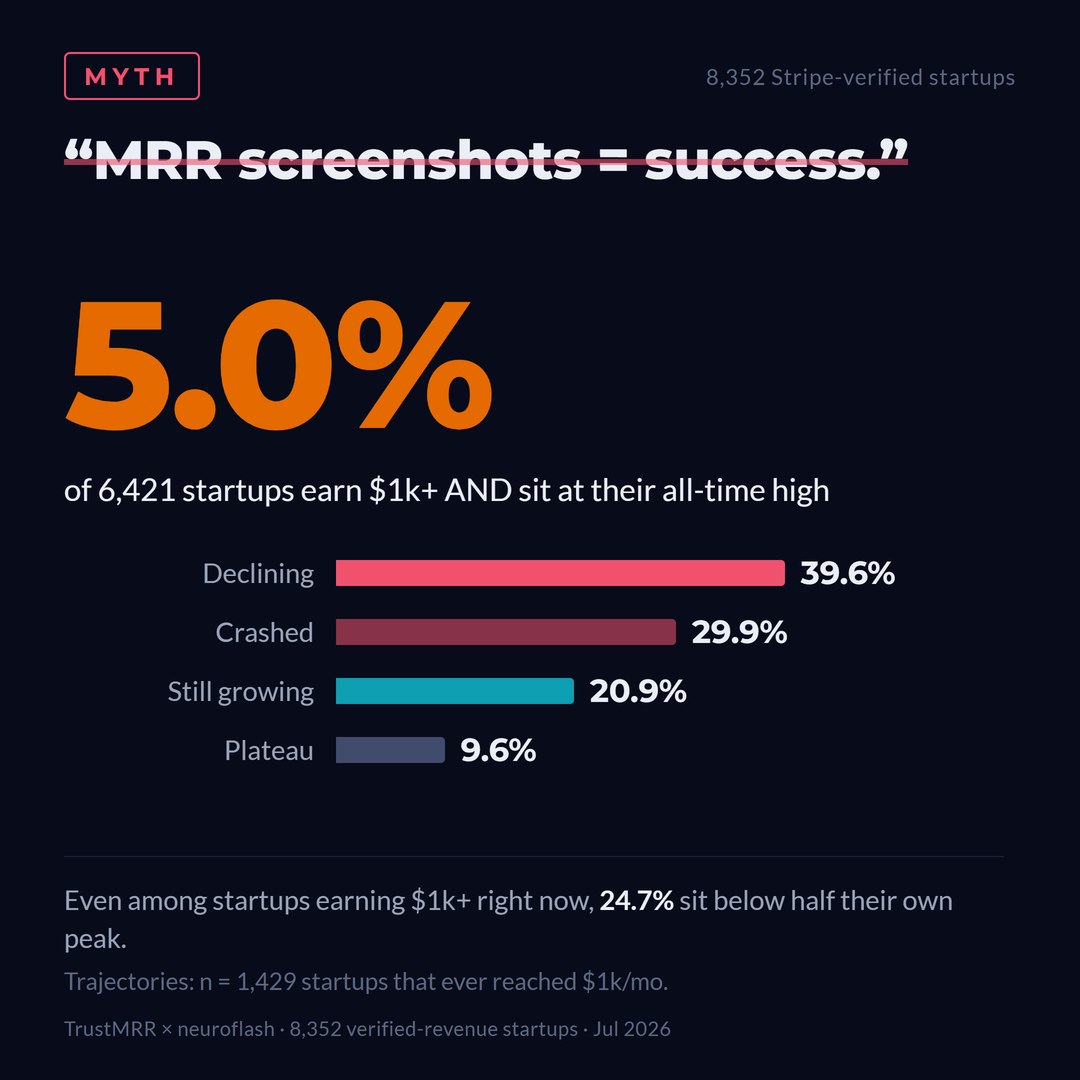
Revenue screenshots are the currency of build-in-public Twitter. The curves behind them tell a different story: of startups that ever peaked at $1k+/month, only 20.9% are still growing. Even among startups earning $1k+ right now, a quarter are below half of their own peak. Zoom all the way out and just 5.0% of 6,421 tracked startups are in the "dream state", currently at $1k+ and at their all-time high. The screenshot shows a point; the market lives on a curve.
Question: Do X followers actually matter?
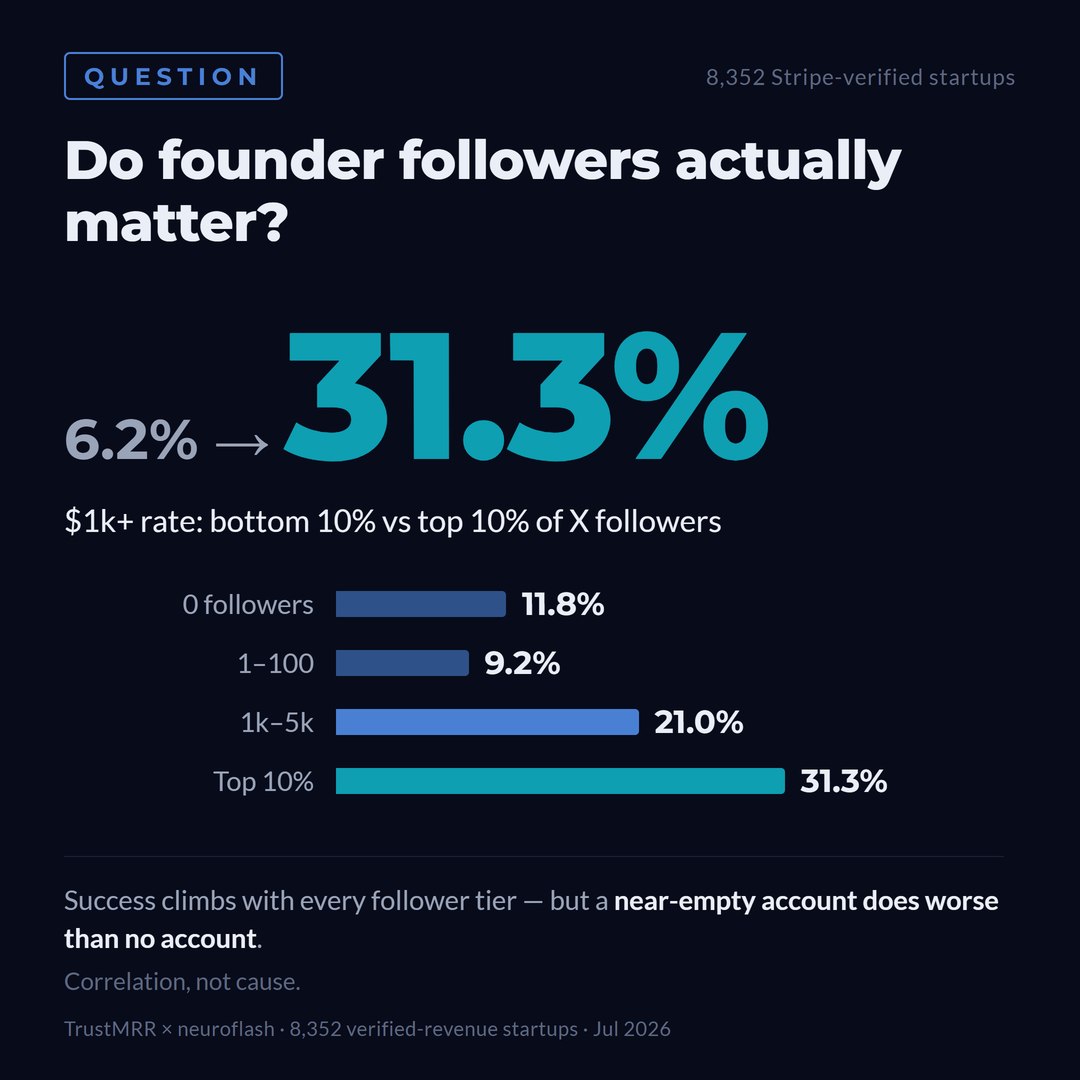
Yes: more than almost anything else we measured. Founders in the bottom follower decile reach $1k/month at 6.2%; the top decile at 31.3%, a five-fold difference with a fairly clean dose-response curve in between. The strangest wrinkle: founders with zero X presence outperform founders with 1–100 followers (11.8% vs 9.2%). Our reading: the zero group contains businesses with real channels elsewhere; the 1–100 group tried the distribution game and doesn't have one. A dead account signals more than no account. (Followers were measured at scrape time, so part of this is success creating followers. The association is real either way, causality runs both directions.)
Question: Can your payment provider predict your survival?
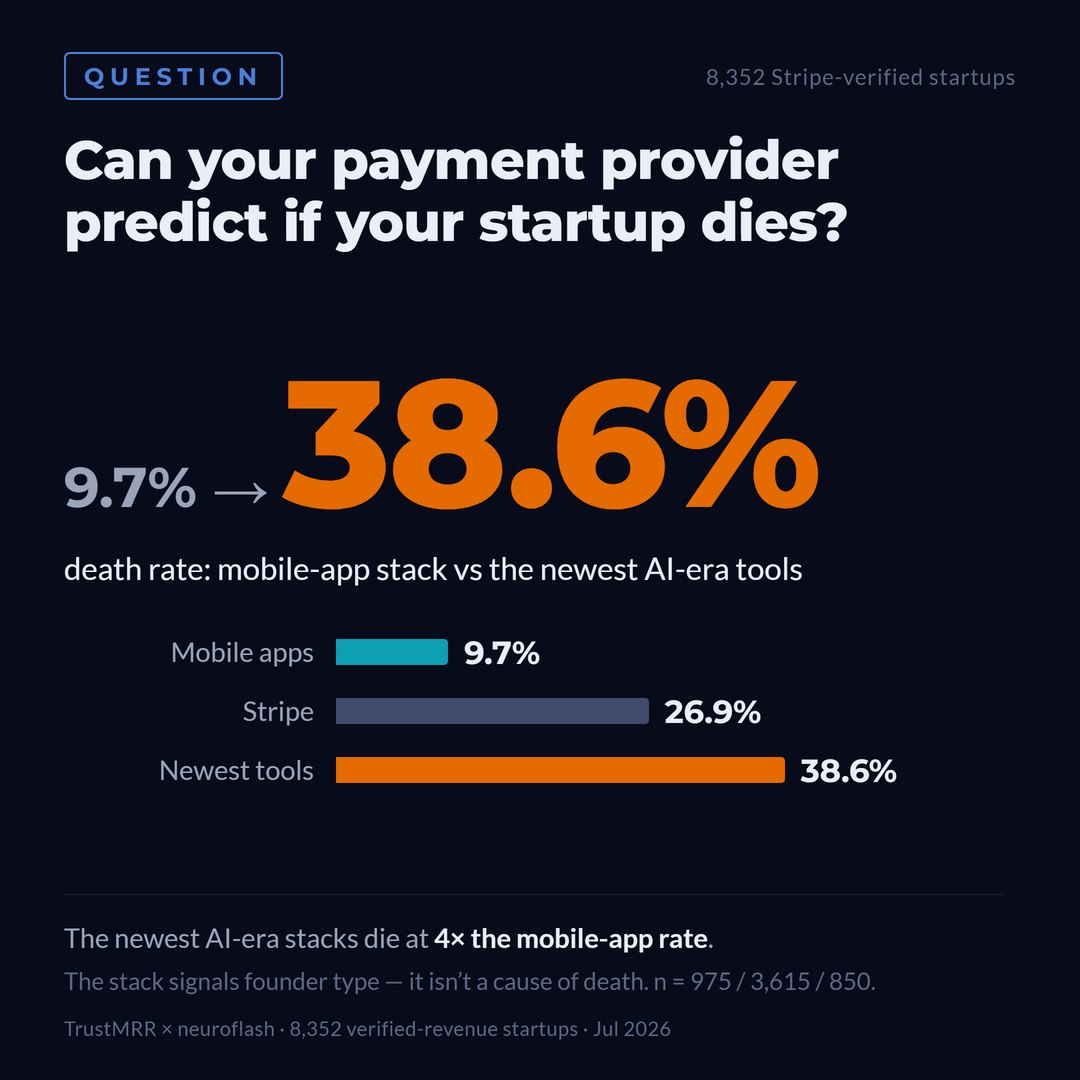
Eerily well. Startups on mobile-app payment stacks (RevenueCat, Superwall) die at 9.7%; classic Stripe startups at 26.9%; startups on the newest AI-era payment tools at 38.6%, a four-fold spread that survives controlling for company age. The provider isn't killing anyone: it's a fingerprint of founder type and product category. App-store distribution produces small money reliably; the newest web stack is the default of fast, low-commitment launches. Tell me your payment provider and I'll tell you your odds, not because of the provider, but because of what choosing it says about you.
Myth 4: "Germany is a startup powerhouse"
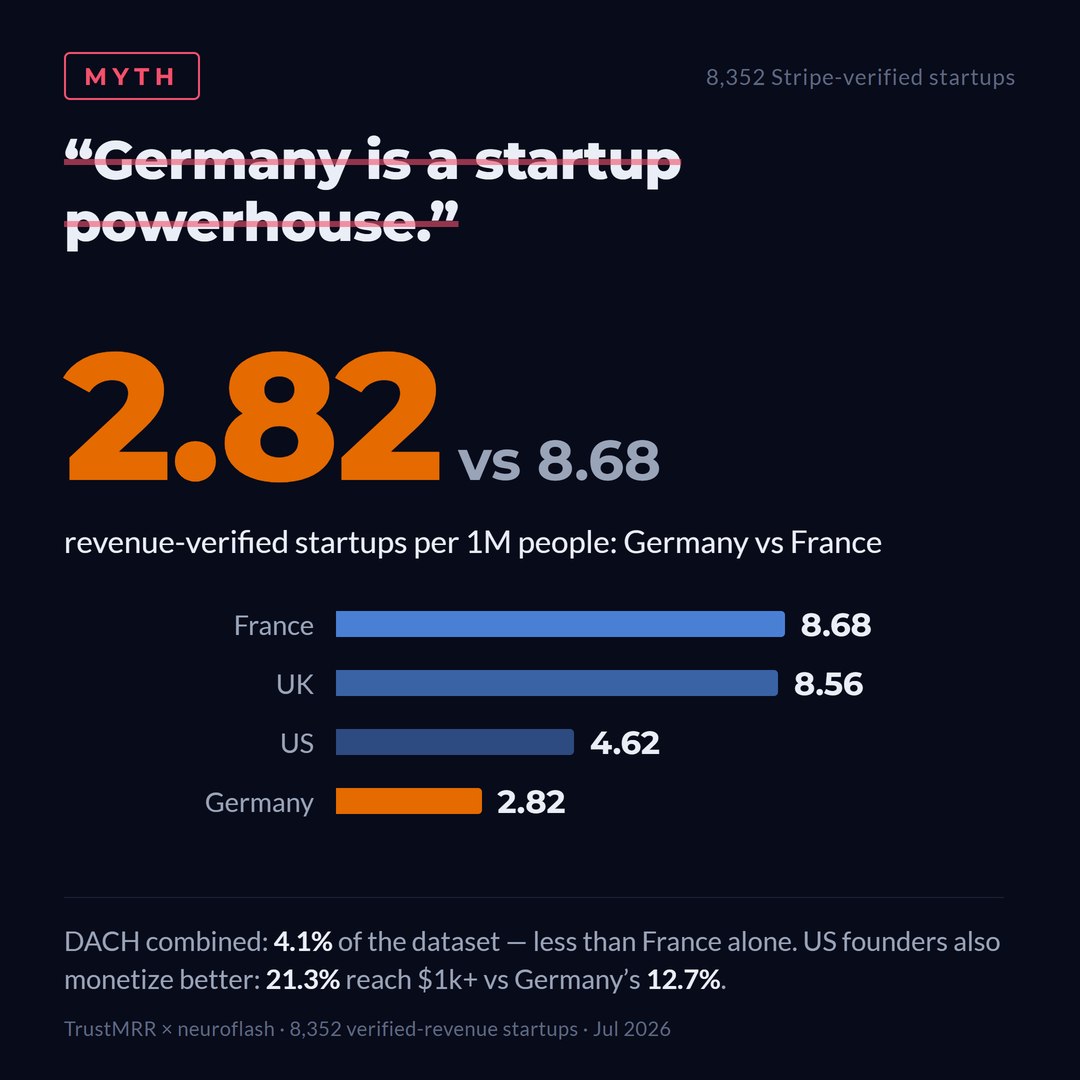
Per capita, France out-founds Germany three to one in this dataset (8.68 vs 2.82 verified-revenue startups per million population), and the entire DACH region is 4.1% of a global corpus it should dominate on GDP. German founders also monetize worse once they're in: 12.7% reach $1k/month vs 21.3% for US founders. Part of this is platform selection. TrustMRR is English-language and X-adjacent, and "build in public" is culturally Anglo-French. But that is the finding: German founders are structurally underrepresented in the distribution channels where indie software revenue currently gets made. I've written elsewhere about how this connects to visibility in AI-mediated search, the same absence, one layer up.
Myth 5: "Pain sells"
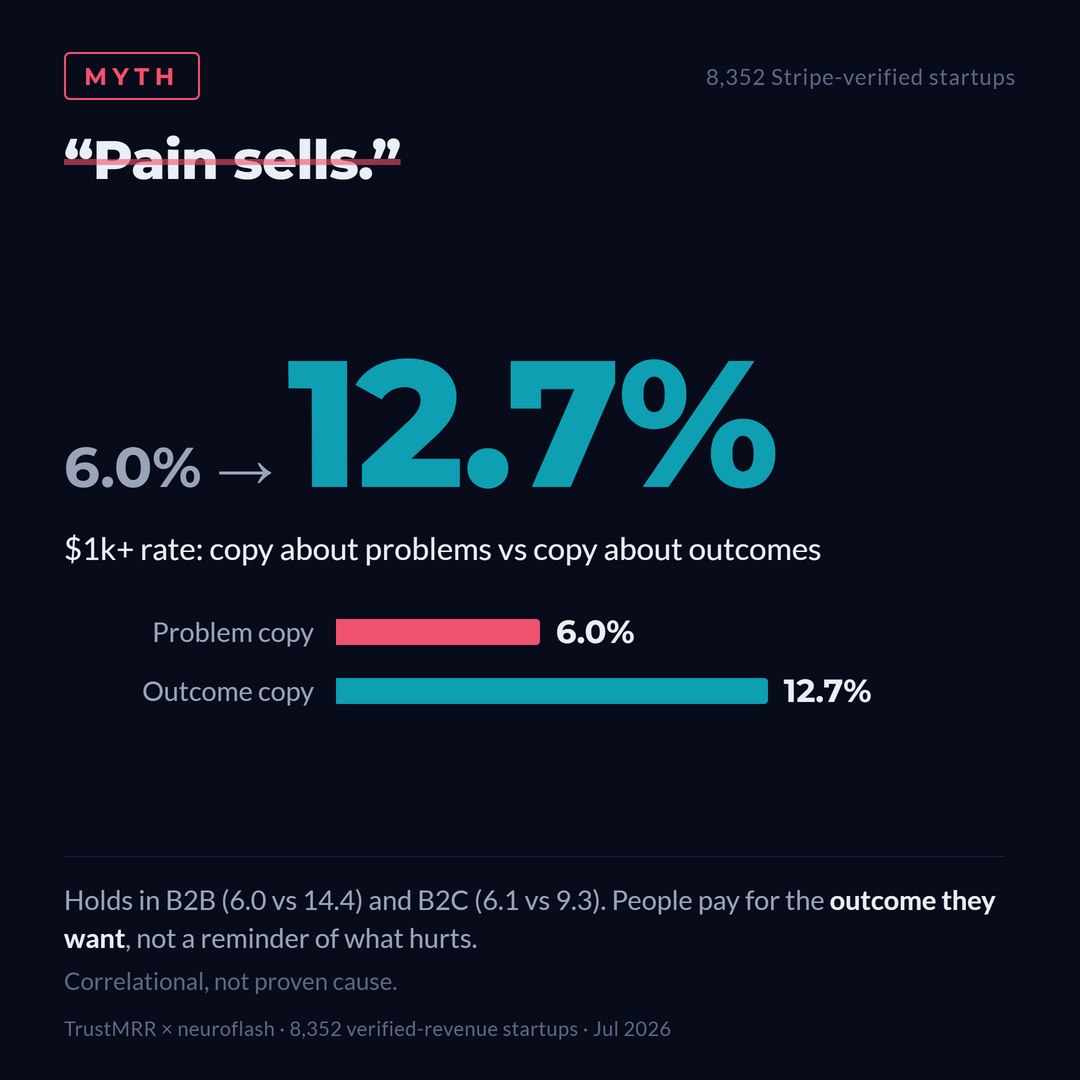
Every copywriting course teaches loss aversion: agitate the pain, then sell the cure. The revenue data disagrees. Startups whose descriptions lead with pain ("stop wasting", "tired of", "avoid mistakes") reach $1k/month at 6.0%; startups that lead with outcomes ("grow", "unlock", "boost") at 12.7%, and the gap holds separately in B2B (6.0 vs 14.4) and B2C (6.1 vs 9.3). The psychologist's reading: loss aversion wins attention, but people pay for a desired outcome, not for being reminded of their inadequacy. The sober alternative reading: struggling products retreat into pain copy. Either way, if your homepage leads with fear, the base rates are not on your side. This is correlational, not proven cause; keep that in mind for every copy pattern in this section. We tested the causal version with AI panels in Part 2, and for the attention side of the same coin, see our applied loss-aversion framing twin-test.
Myth 6: "Talk about the customer, not the product"
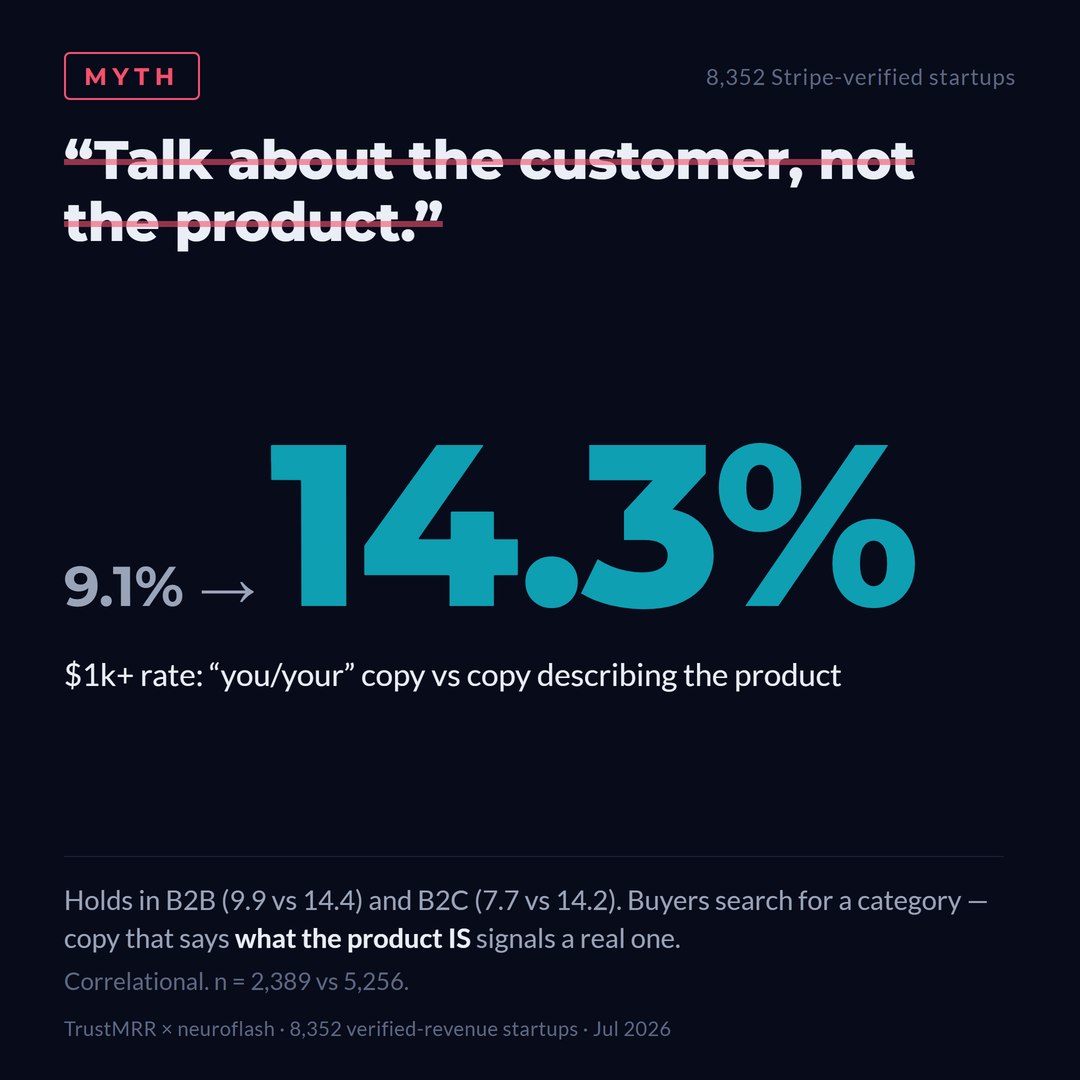
The most heretical finding in the set. Descriptions written in the second person ("you", "your") hit $1k/month at 9.1%; descriptions that plainly state what the product is hit 14.3%. It survives the obvious confound: the gap holds in B2B and B2C separately. Speed promises ("in seconds") show the same negative pattern (8.8% vs a 12.7% baseline). Our interpretation: B2B buyers search for a category, and concrete descriptions signal a real product in a real category, while "you"-copy correlates with template-following first-time founders. Serious products are named by what they are.
Myth 7: "AI-naming fatigue is real"
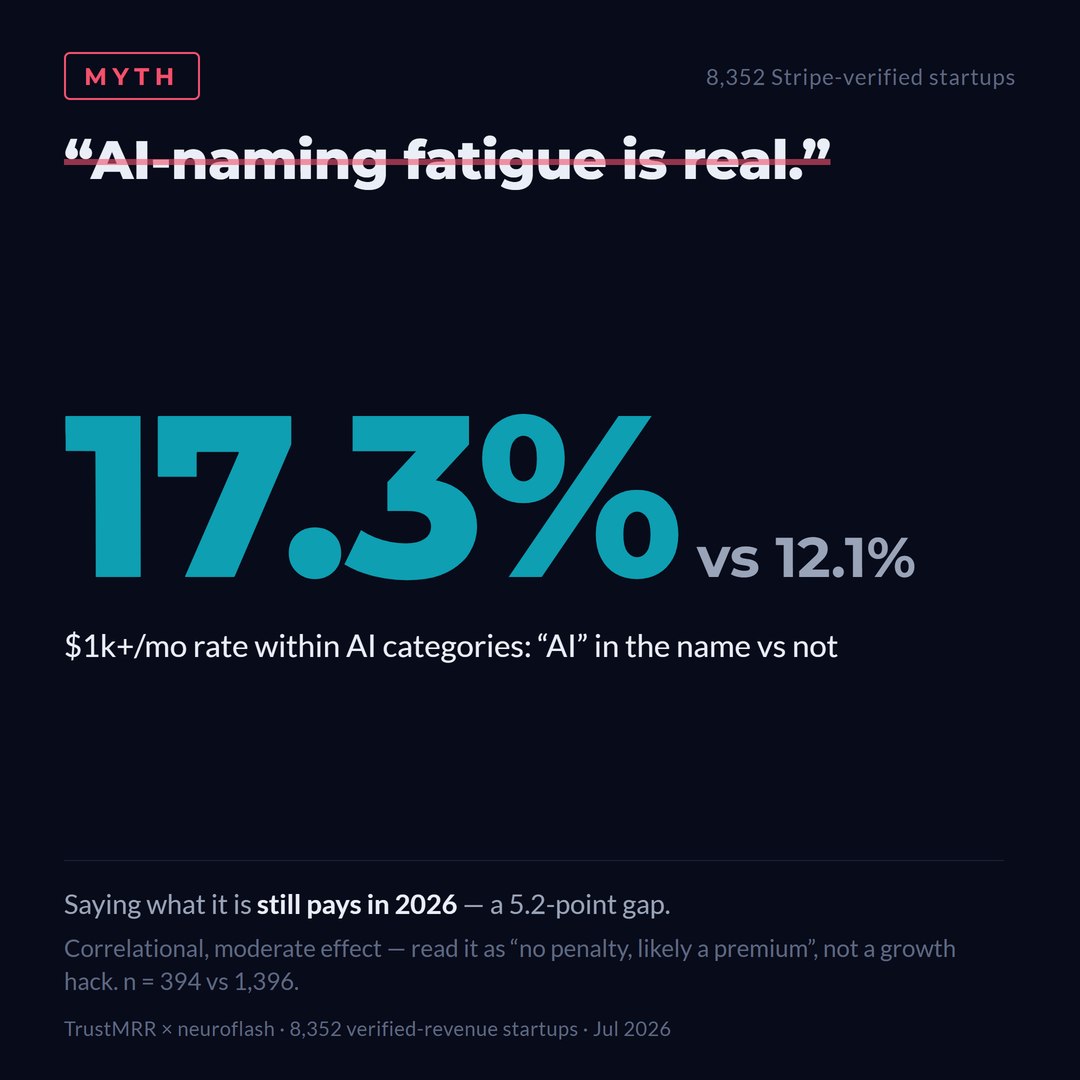
A LinkedIn favorite: "customers are tired of AI-everything: hide it." Within the AI category (to control for product type), products with "AI" in the name reach $1k/month at 17.3% versus 12.1% without, a 43% relative premium, in 2026, with the same direction across the whole dataset. Specific, category-declaring names win; the fatigue narrative is not in the revenue data.
Planning an event on AI, consumer psychology, or market research? Book Jonathan Mall as a keynote speaker: these findings, live on stage, with the methodology to back them.
Part 2: Could AI have predicted any of this? We tested our own product.
Here's where it gets uncomfortable for my industry. Synthetic research panels, LLM-based respondents, including our own Digital Twins, are sold on the promise of predicting market response before launch. Vendor validation is almost always "our panel agreed with a human survey." We wanted a harder test: agreement with verified money.
So we locked in two experiments, with thresholds and kill clauses frozen before the first AI call. Roughly 4,700 twin responses later, here is what happened.
Experiment 1: Can twins pick the winner from the pitch alone?
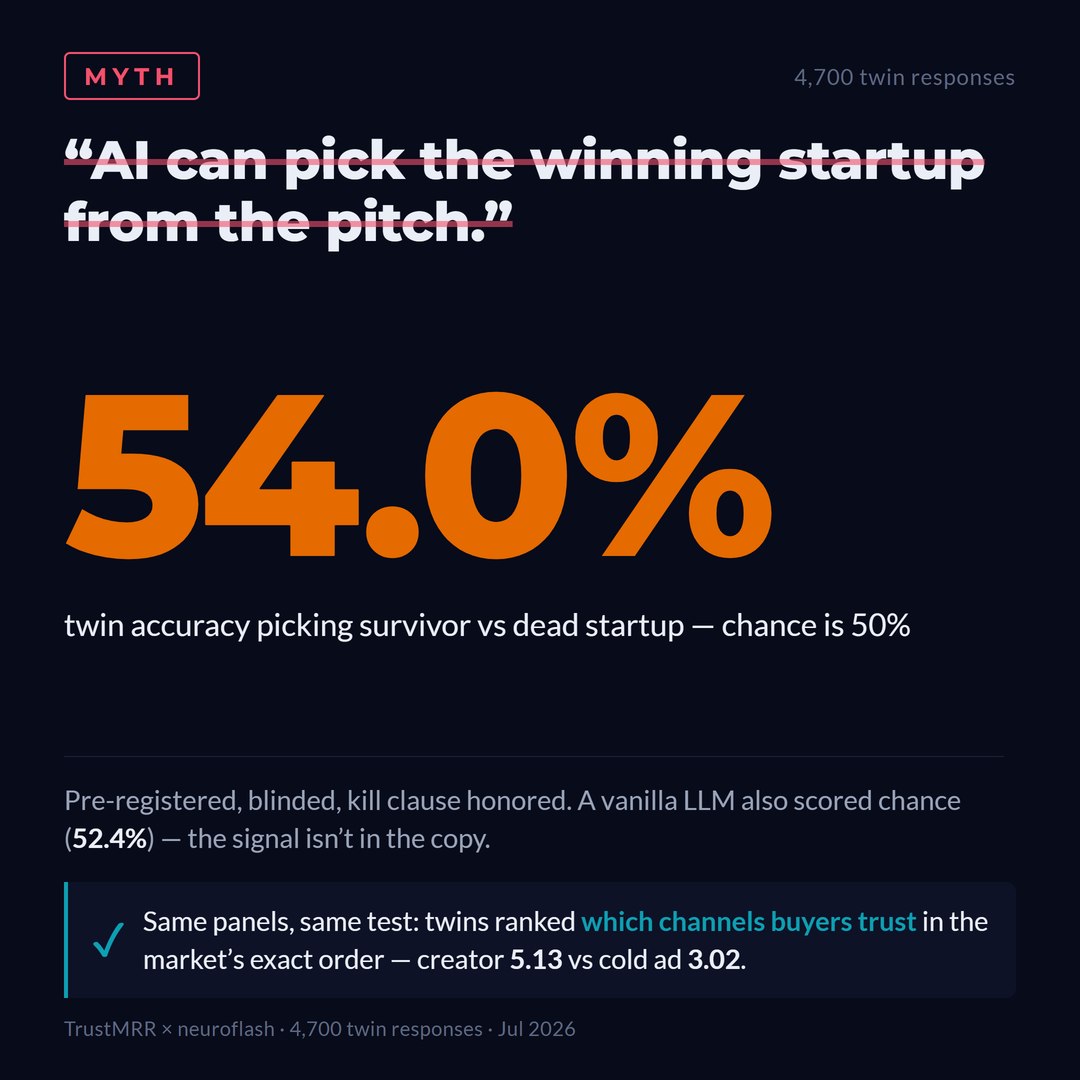
We showed audience-matched twin panels pairs of scrubbed startup descriptions: one that went on to earn verified revenue, one that died, all identifying and success signals removed, and asked: which would you pay for? Result: 54.0% accuracy against a 50% coin flip (p =.31, n = 63 clean pairs). The kill clause we had committed to in advance fired. Crucially, a vanilla LLM with no twin grounding also scored at chance (52.4%): the information simply isn't in a one-paragraph pitch. Distribution, execution, and timing, the things that actually decided these startups' fates, are invisible in the text. Nothing that reads only the pitch can predict the outcome, and anyone claiming otherwise is selling you a coin flip. Note what this failure is not: it isn't evidence that twins misread buyers. The same panels, in the same experiments, read channel trust and message quality in the market-correct direction (section below). The failure is specific to the question. Asking any pitch-reading AI to forecast a company's fate is asking it to see distribution and execution in a paragraph that contains neither.
Experiment 2: Do twins at least reproduce the market's copy patterns?
Then we ran the subtler test. Those correlational copy patterns from Part 1, pain vs gain, "you"-copy vs plain, AI-naming, speed promises, have a known confound: maybe weak founders just write pain copy. So we did what observational data can't: we took the same offers and rewrote them both ways, changing only the framing, and had twin panels judge 9 pre-specified pattern directions.
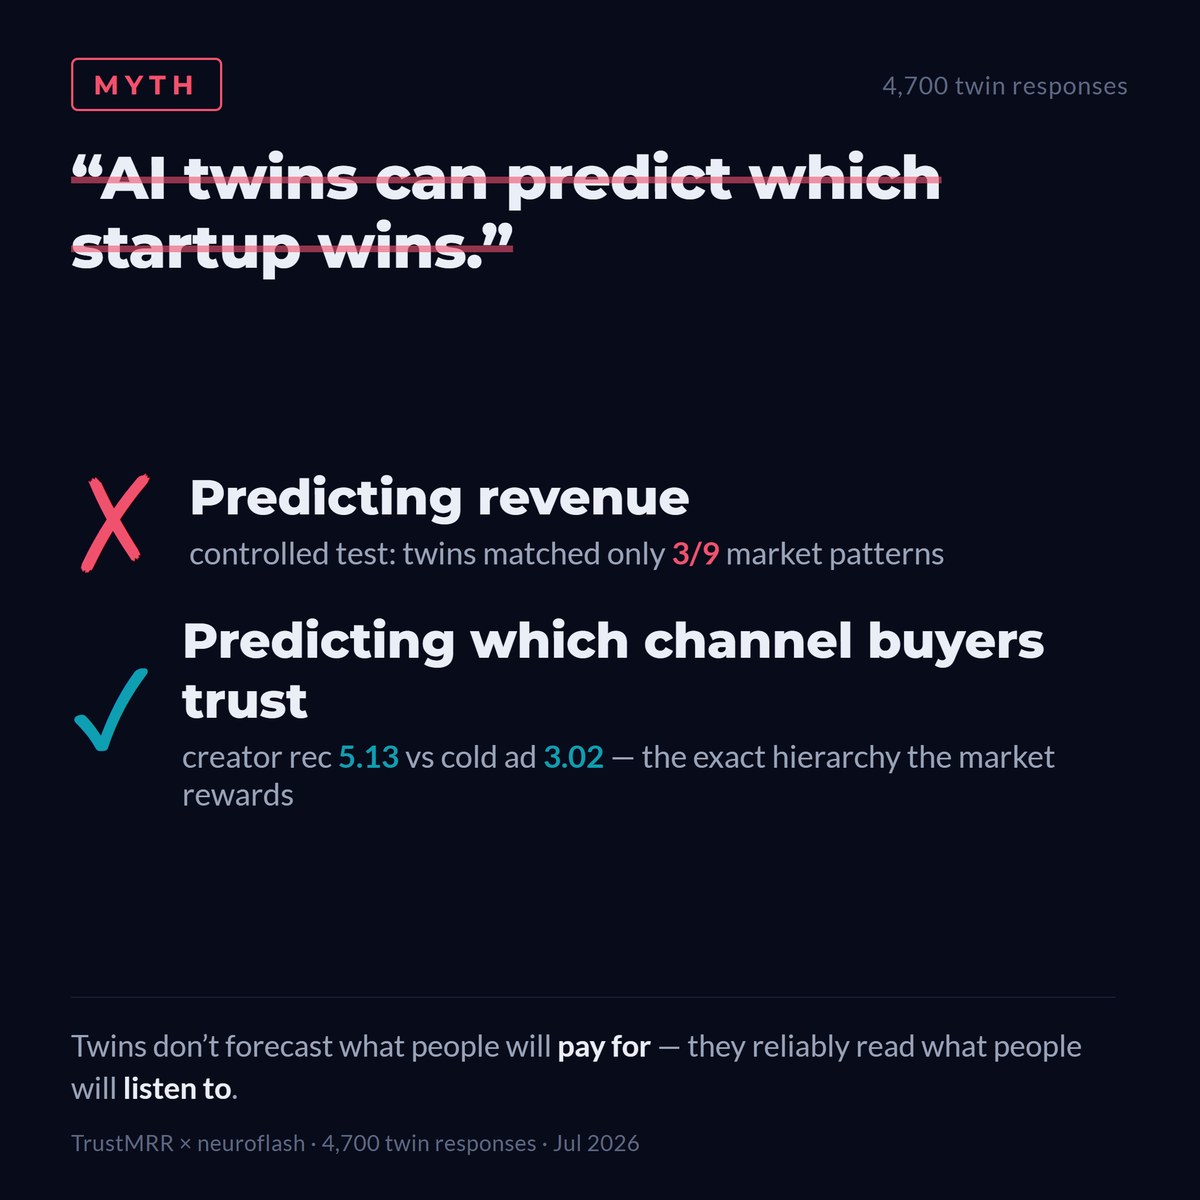
Twins matched the market's revealed direction on 3 of 9. The kill clause fired again. Worse: where the twins were most confident (preferring speed promises and "you"-copy), the market pointed the other way; across hypotheses, twin effect sizes anti-correlated with market effect sizes at −0.69. The twins reproduced marketing dogma, what every copywriting course teaches, what people say convinces them, rather than what verified revenue rewards.
There are three honest readings, and we can't fully separate them yet: (1) the twins failed; (2) the observational patterns themselves are founder-quality confounds that a controlled test correctly refuses to reproduce; (3) twins faithfully simulate human stated preference, which genuinely diverges from revealed monetization, the oldest gap in market research, inherited by its newest tool. A human-panel study on the identical pairs is prepared to arbitrate. But whichever reading wins, one conclusion is already solid: synthetic panels should not be sold as revenue forecasters, and, as the next section shows with the same data, they don't need to be. What they measure instead is worth more to a working marketer.
What twins CAN do: validated on the same data
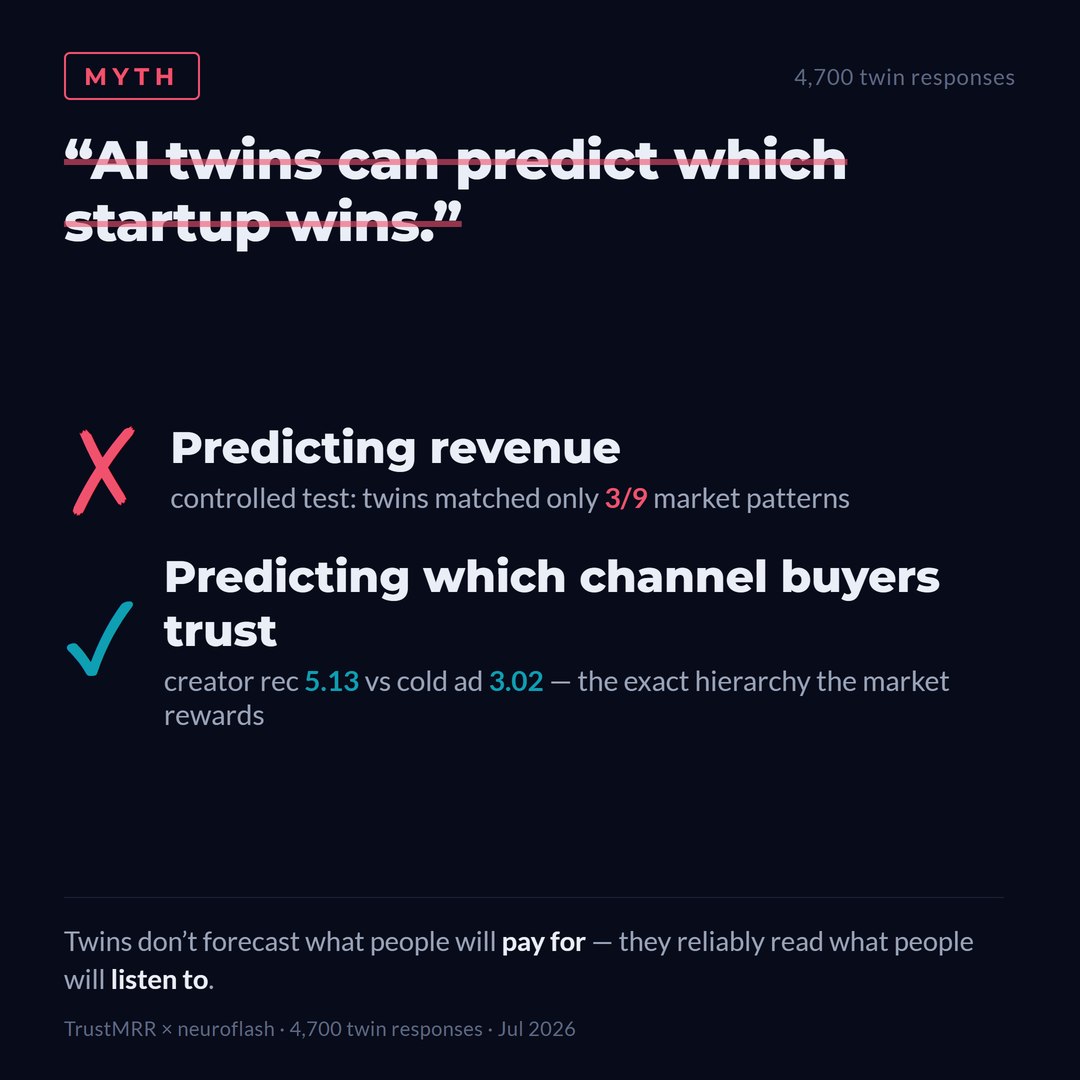
The same experiments produced real positives, and this is the part most coverage of "AI panels fail" would bury. Where the question is which channel or which message, the twins didn't just perform. They matched the money.
1. Channel: twins reproduced the market's trust hierarchy, in the right order, with the right gaps
We showed twin panels the same product under five different discovery contexts and asked how likely they'd be to actually pay. The result is a clean, steep hierarchy: recommended by a creator you trust 5.13/10 → recommended by a partner/agency 4.75 → found in the app store 4.34 → free-tool upgrade prompt 4.25 → cold ad from an unknown company 3.02. A 70% trust premium for a trusted voice over a cold ad, with warm referrals in between, exactly the ordering the revenue data rewards.
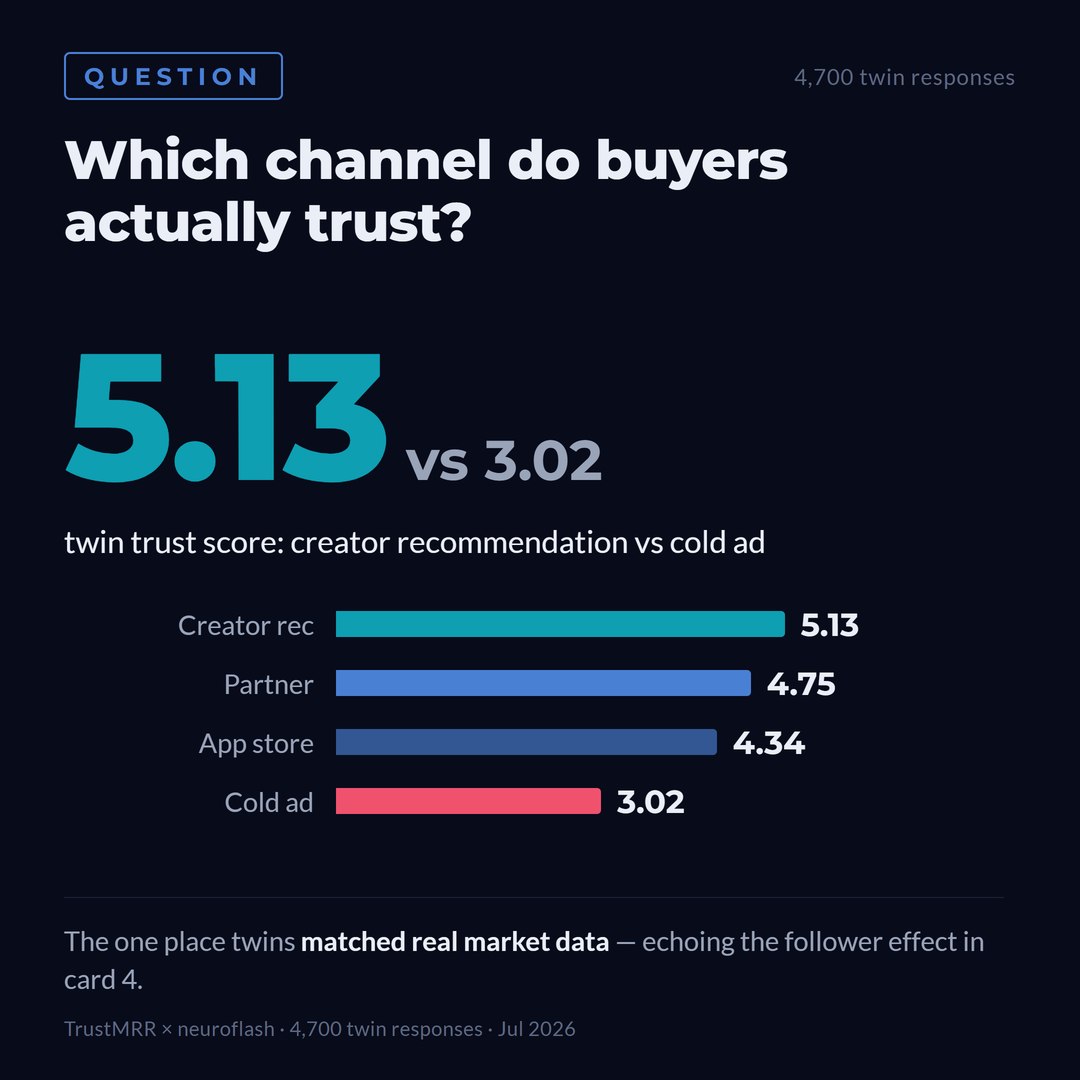
And here's why that's not a lucky guess: the market data contains the same hierarchy, independently measured. The follower dose-response (Myth 4) is creator-trust expressed in revenue. Founders with an audience convert at 5× the rate of founders without one. The payment-stack finding (the survival question above) is the app-store channel expressed in survival, mobile-distributed products die at a quarter the rate of cold-web launches. Two of the three biggest effects in 8,352 startups are channel effects, and the twins ranked those channels correctly without ever seeing a revenue number. If you're deciding between influencer partnerships, partner referrals, marketplace presence, or paid cold traffic, a twin panel gives you the market's answer in an afternoon.
2. Message content: twins reward the same copy properties the revenue data rewards
On how to say it, the twins aligned with the market on the property that matters most: concreteness. Given the same offer written as abstract benefit-speak ("transform your workflow") versus a concrete category statement ("an API that does X"), twins chose the concrete version 66% of the time, the exact direction the revenue data points (plain, category-declaring descriptions monetize at 14.3% vs 9.1%, Myth 6). Say what the thing is: the market rewards it, and twins detect it.
Experiment 1 added a subtler discovery about message quality: when we asked twins for their biggest objection to each offer, their objections were stronger against the startups that went on to win. That sounds backwards until you see the mechanism: winning offers are specific enough to argue with; doomed ones are too vague to provoke a reaction. In practice this makes the twin panel's negative feedback a feature, "I can see exactly why this wouldn't work for me" is a healthier signal than polite indifference. If your concept test comes back with no objections, worry.
The paired experiments also gave us a working diagnostic we now use on real client material: asking twins "which product would you choose?" and "which pitch is more convincing?" produces different answers on roughly a quarter of comparisons (23 of 96 pairs). Those divergences isolate exactly the two failure modes a founder needs to tell apart, a good product with weak marketing, or slick copy on a weak offer. No revenue data required: the twins separate the message from the merchandise.
3. Within one context, the accuracy is documented, and high
None of this is new behavior for the method. Where the task is comparing finished messages within one brand and one context, the setting our client validations measure, twin panels have hit 98% agreement with human panels (Essity) and 92% (Oetinger), and our public twin-test series keeps replicating classic behavioral-economics effects on modern e-commerce material. What these two new experiments add is the boundary: that within-context message-and-channel skill does not extend to forecasting whose company survives. The experiments also documented a reproducible calibration fact we now disclose in client work: twin panels systematically overrate offers targeted at founders and indie-hackers, the segment that monetizes worst in the real data. A bias you have measured is a bias you can correct for.
So the honest, evidence-based claim for synthetic research in 2026 is narrower and more useful than the sales pitch: twins don't forecast what people will pay for. They reliably read what people will listen to. Which channel your buyers trust: validated, in the market's own order. Which version of your message lands, how concrete it should be, where its real objections sit: validated. Which startup gets rich: not a fair question to ask of any pitch-reading AI, ours included.
What this means for you
- If you're a founder: your first 90 days are the verdict, your distribution is your destiny, and your copy should say what the product is, name the outcome, and skip the pain theater. Build the audience before the product. The dose-response curve is the strongest signal in 8,352 startups.
- If you're a marketer: treat every "proven copywriting law" as a hypothesis. Half of the ones we tested pointed backwards against verified revenue. But don't conclude "test nothing": the two decisions twin panels answered correctly against the money are exactly the two you face weekly: which channel your buyers trust (creator > partner > marketplace > cold ad, in the market's own order) and which version of your message lands (concreteness wins, real objections beat polite indifference). Use synthetic panels for those questions; for revenue forecasts, demand revealed-outcome validation, not survey-agreement percentages, from any vendor, ours included. The buyer's guide to digital-twin software lists the questions to ask.
- If you're evaluating AI research tools: ask the vendor what their panel cannot do. If the answer is "nothing", show them this article.
Want to test your own messaging against matched twin audiences, within the validated boundary? Book a conversation with Jonathan or explore the complete guide to digital twins in market research.
Methodology & transparency
Data: TrustMRR corpus, 8,352 startups with provider-verified 30-day revenue (Stripe et al.), scrape-validated at 93.5% field accuracy; revenue timeseries Jul 2025. Jun 2026. Corpus caveats: self-listed, indie/self-serve skewed, English-language-platform selection. Copy-pattern findings (myths 5–7) are correlational; description style may proxy founder quality. That confound is exactly what Experiment 2 was designed to probe. Both experiments ran on protocols, thresholds, and kill clauses frozen before any AI call: Experiment 1 (individual outcome prediction, 96 age-matched scrubbed pairs, audience-matched panels, vanilla-LLM and metadata baselines) and Experiment 2 (9 controlled same-offer rewrite tests against corpus-mined pattern directions, ~1,400 responses). Both kill clauses triggered and are reported here at full prominence, per protocol. A human-panel arbitration study on the identical stimuli is prepared under the same frozen-protocol rules and pending. The full paper, protocols, per-endpoint results, and sanitized data, is available on request, and the twin methodology behind the applied series is documented in the method comparison.
Sources
- TrustMRR: provider-verified startup revenue data (trustmrr.com), scraped & validated Jul 2026
- neuroflash Digital Twin experiments v1 & v2, protocols with thresholds and kill clauses frozen in advance, Jul 2026 (paper available on request)
- Argyle, L. et al. (2023). Out of One, Many: Using Language Models to Simulate Human Samples. Political Analysis
- Horton, J. (2023). Large Language Models as Simulated Economic Agents. NBER Working Paper 31122
- Morwitz, V. et al. (2007). When do purchase intentions predict sales? International Journal of Forecasting
- Zaltman, G. (2003). How Customers Think. Harvard Business School Press